Kudra
"Fleet operations ran on phone calls and spreadsheets — every trip status required someone to pick up the phone."
Trip creation alone took ~15 minutes per trip, coordination happened over calls, WhatsApp, and paper, and destination branches routinely had zero warning before a vehicle arrived. Kudra replaced that with a single, structured trip management system.
The Overview
Kudra turns fragmented logistics operations into one trip management system — beyond vehicle tracking, into structured workflows for fleet managers, branch operators and logistics teams.
The goal was to cut the dependency on calls and spreadsheets while improving visibility across trips, drivers, fuel and fleet analytics, with every vehicle movement tied to a structured trip.
The Operational Reality
How logistics teams coordinated
- Phone calls
- WhatsApp communication
- Spreadsheets
- Paper-based tracking
What this created
- No structured trip lifecycle
- Lack of trip visibility
- Poor coordination between branches
- No centralized fuel tracking
- Limited driver accountability
- No operational analytics
Vehicles were moving without operational context.
Teams could not easily identify:
The North Star
A central control system for logistics fleets, with full visibility into trip planning, dispatch, monitoring and analytics.
A workflow-first ecosystem where operations run on structured trip lifecycles rather than fragmented communication.
From phone calls to a measurable operation
The same fleet, at four points in its move from conversation-driven coordination to a structured, trip-centric system.
- 01
Manual, call-heavy operations
Fleet coordination ran on conversation. Status lived with whoever last picked up the phone.
- Phone calls
- WhatsApp communication
- Spreadsheets
- Paper-based tracking
- 02
Structured workflows
Every operation became a defined step with a defined output, from trip creation through to reporting.
- Trip Creation
- Trip Dispatch
- Ongoing Monitoring
- Fuel Tracking
- Driver Halt Tracking
- Trip Completion
- Reports & Analytics
- 03
A trip-centric system
The trip replaced the vehicle as the unit of work, and carried its own state from creation to reconciliation.
- Created
- Dispatched
- Ongoing
- Completed
- Closed
- 04
Data-driven fleet operations
With every movement tied to a structured trip record, the operation could finally be measured.
- 40% · Reduced manual operational coordination
- 78% · Faster trip creation
- 100% · Trip cost visibility
- 60% · Reduction in reporting effort
Who Uses Kudra?
Fleet Managers
Responsibilities
- Trip creation
- Vehicle and driver assignment
- Monitoring active trips
- Fleet analytics
Pain Points
- ✗ Tracking many trips at once
- ✗ Excessive calls
- ✗ No fuel visibility
- ✗ No central dashboard
Branch Managers
Responsibilities
- Incoming and outgoing vehicles
- Status updates
- Dispatch coordination
Pain Points
- ✗ No visibility into incoming trips
- ✗ Delayed updates
- ✗ Manual communication
Accounts Teams
Responsibilities
- Fuel expenses
- Driver halt payments
- Trip reconciliation
Pain Points
- ✗ Missing records
- ✗ Manual verification
- ✗ No trip-level financials
Understanding the Operations
To better understand operational workflows, interviews and observational research were conducted with logistics operators, dispatch teams, and fleet managers. Research focused on:
Research Approach
Structured interviews and contextual observation sessions with logistics operators across multiple branches. Focus was on shadowing real operational workflows — not just asking about them.
What We Discovered
Trips, Not Vehicles, Are the Operational Unit
Managers talked about "the Chennai trip", never "truck KA-01-AB-1234". This became the foundation of the product strategy.
Operational Data Was Fragmented
Trip information lived across calls, WhatsApp, spreadsheets and memory. Every status update required a phone call.
Managers Needed Real-Time Visibility
Active trips, delayed vehicles, driver activity, fuel and completion status — without making a call.
Branches Needed Automatic Updates
Destination branches were often unaware of incoming vehicles, causing dock-planning failures at every hub.
What We Were Designing For
Simplify operational workflows
Fewer steps per core fleet operation
Reduce coordination dependency
Visibility that removes the manual status call
Improve active trip visibility
Real-time context on every moving vehicle
Reduce cognitive overload
The right information at the right moment, not everything at once
Enable faster trip creation
From 15+ minutes to under 2
Scale the workflow
Works at 10 vehicles and at 1,000
Platform Structure
The platform architecture was designed around operational efficiency — ensuring quick access to the most-used workflows while reducing navigation complexity.
Dashboard
Real-time fleet status, active trips, vehicle states, and operational KPIs.
Trip Management
Create, dispatch, monitor, and close trips through a structured lifecycle.
Vehicle Management
Vehicle profiles, maintenance records, performance analytics, and status.
Driver Management
Driver profiles, trip history, halt logs, and efficiency tracking.
Reports & Analytics
Fleet-wide reports on fuel, trips, vehicles, and drivers with export.
Notifications
Automatic branch alerts and operational announcements across hubs.
Frequent Routes
Route suggestions based on historical trip data to speed up creation.
Locations
Manage branches, hubs, and delivery points used in trip planning.
The working drawings
Field research, synthesis and structure — the artefacts the finished screens came out of.
Coordination runs on people
- Trips coordinated verbally between fleet and branches
- Call frequency high; information lost in verbal updates
- Branches learn about incoming deliveries by phone
The record is scattered
- Trip info lives across calls, WhatsApp, spreadsheets, memory
- Paper-based fuel records with accuracy gaps
- No single place to check what a vehicle is doing
People think in trips, not vehicles
- Managers say “the Chennai trip”, not a registration number
- Status questions are about a journey, not an asset
- Cost only makes sense per trip, not per vehicle
- 01Created
- 02Dispatched
- 03Ongoing
- 04Completed
- 05Closed
The Trip Lifecycle
Trip Creation
- Select origin and destination
- Assign driver and vehicle
- Select route from frequent route suggestions
- Add freight and planned trip details
Trip Dispatch
- Capture starting odometer
- Record starting fuel level
- Confirm dispatch — status changes to Dispatched
- Automatic notifications sent to destination branch
Ongoing Monitoring
- Track vehicle movement on live map
- Monitor trip progress and checkpoints
- View refueling updates in real-time
- Track driver halt activity and delays
Fuel Tracking
- Operators record refueling amount and cost
- Fuel quantity and location captured per stop
- Enables mileage and efficiency reporting
- Data tied directly to the active trip record
Driver Halt Tracking
- System records halt locations and durations
- Halt reasons and waiting times captured
- Improves operational accountability
- Supports driver payment calculations
Trip Completion
- Capture ending odometer and fuel level
- Platform auto-calculates distance, mileage, and fuel efficiency
- Trip duration and completion time recorded
- Status moves to Completed → Closed
Reports & Analytics
- Vehicle reports — mileage, fuel efficiency, utilization
- Driver reports — halt duration, trip completion history
- Operational reports — route performance, fleet utilization trends
Trip Lifecycle States
The lifecycle was intentionally simplified to improve operational clarity and reduce process confusion across all stakeholder groups.
From Concept to Structure
Early explorations focused on establishing the right operational hierarchy before touching visual design.
The Balancing Act
Low-fidelity wireframes went through 5 rounds of iteration. The central challenge was balancing three competing forces across every screen:
Low-fidelity wireframes established:
- Status prioritization hierarchy
- KPI card placement
- Navigation structure
- Workflow step sequencing
Visual Language
Design Principles
UI Decisions
- Color-coded trip states (Created / Dispatched / Ongoing / Completed / Closed)
- Structured dashboard cards with consistent header, filter, and data zones
- Clear typography hierarchy — metrics large, labels small, metadata smallest
- Modular analytics widgets that can be added/removed per user role
- Simplified operational tables with status-first column ordering
Status Color Semantics
The Final Platform
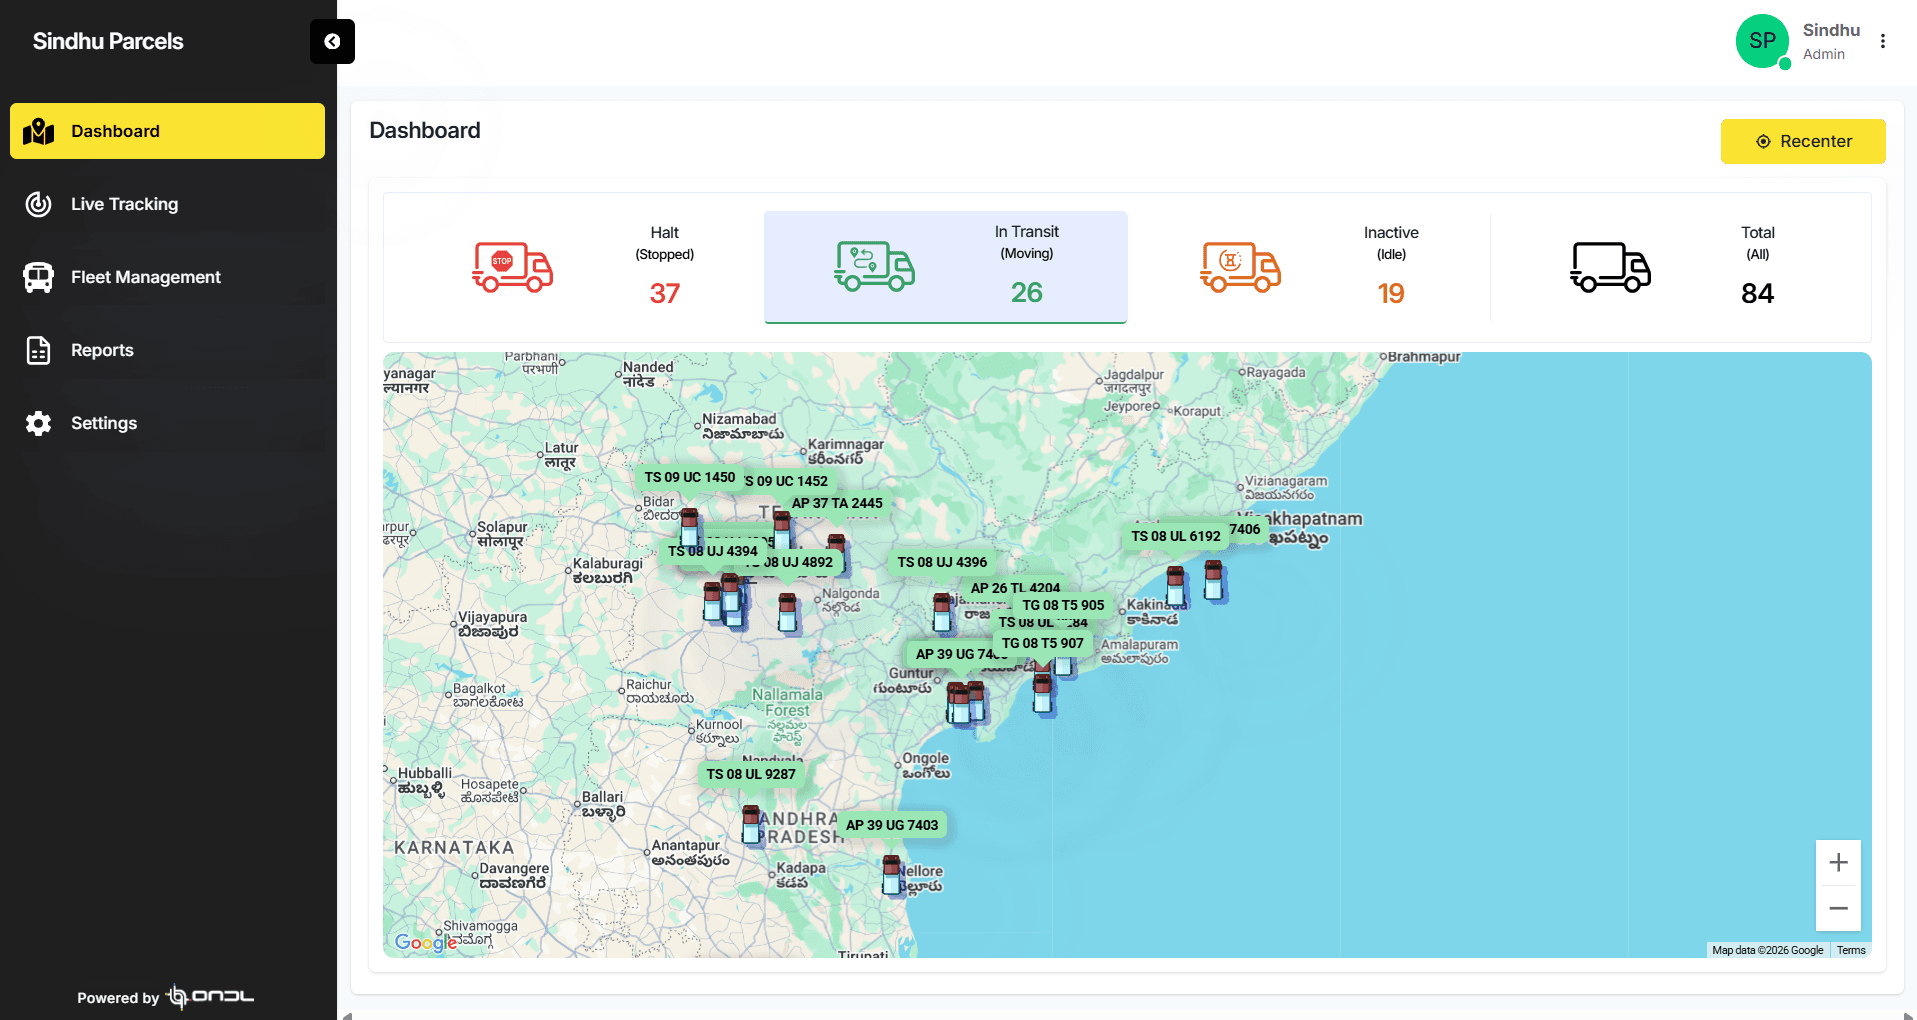
The final UI adopted a clean enterprise SaaS aesthetic — dark layouts, structured cards, clear status indicators, and analytics-first interfaces prioritizing active trips, vehicle statuses, and fleet performance metrics.
Live Fleet Operations Dashboard — 84 vehicles, real-time status tiles, active trip monitoring
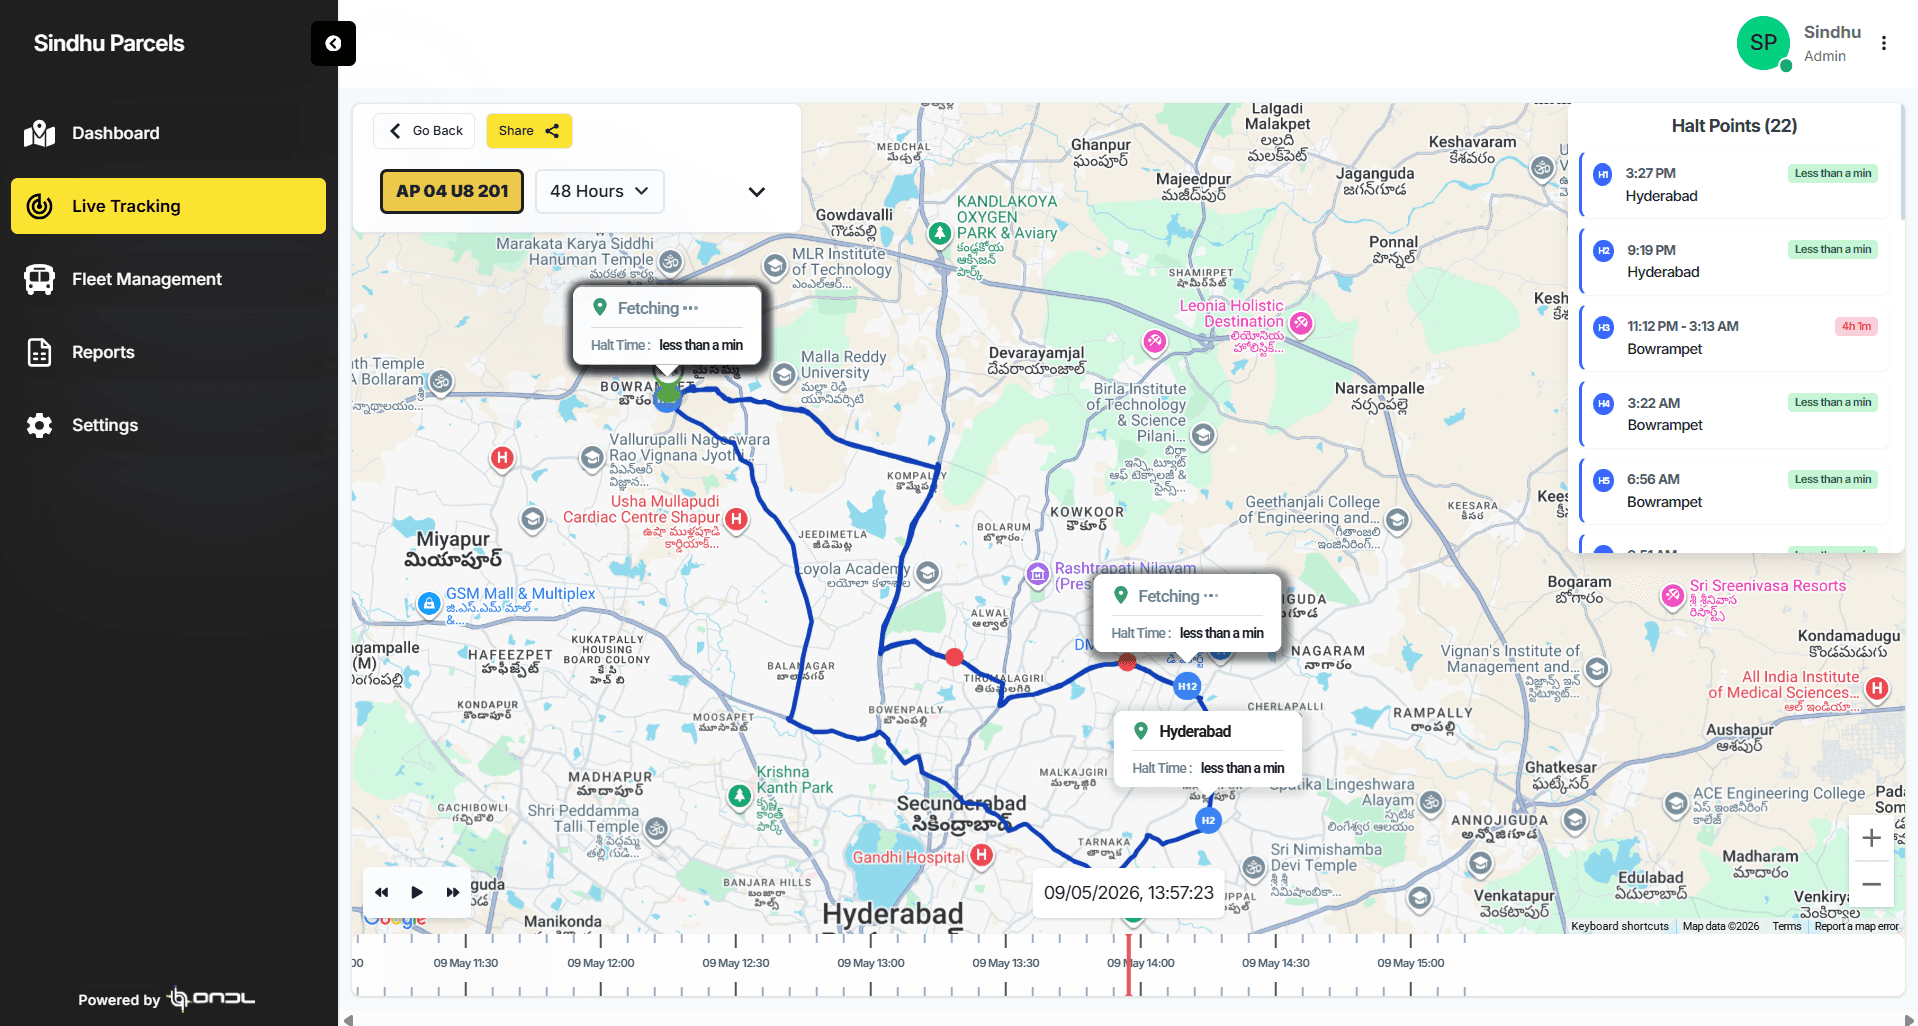
Live Tracking ModuleLive Tracking
Real-time vehicle route visualization on an interactive map, with halt-point timeline, duration markers, and 48-hour playback. Operators can trace a vehicle's exact path and pinpoint every stop.
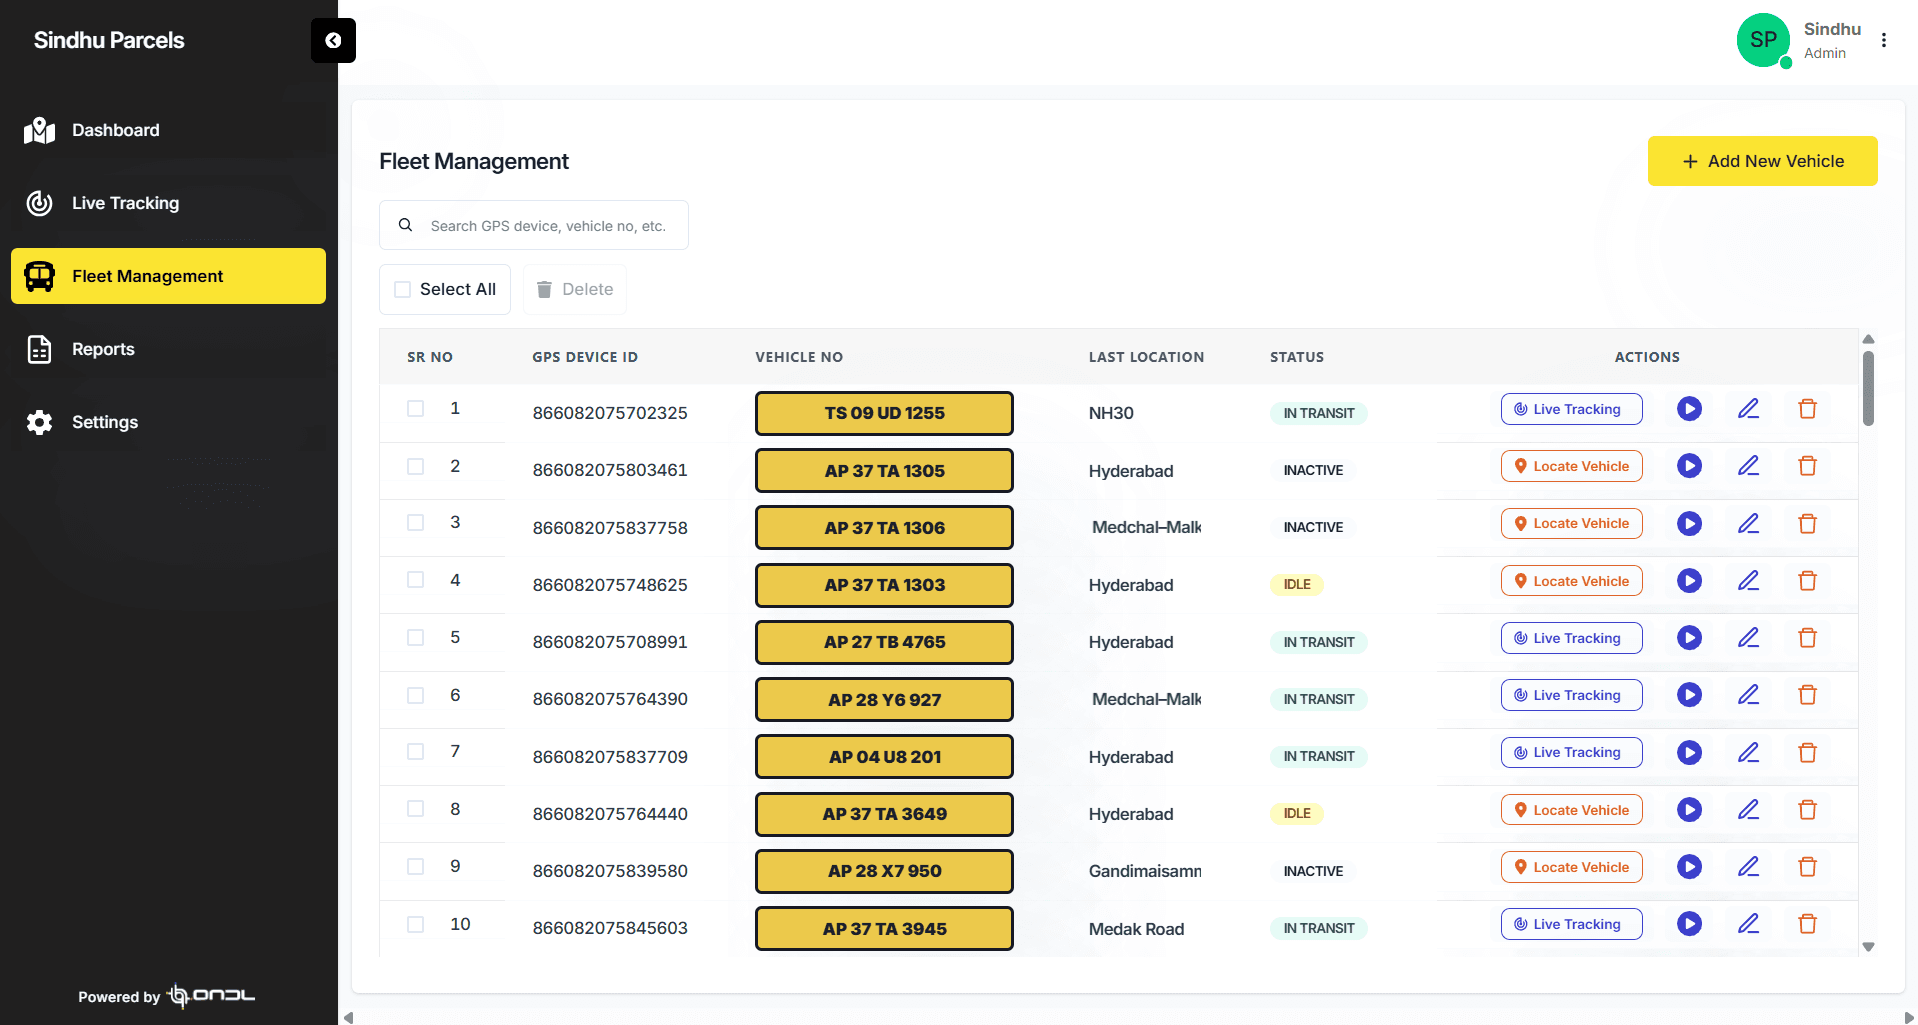
Fleet Management ModuleFleet Management
A structured vehicle registry showing GPS device IDs, vehicle numbers, last known location, operational status (In Transit / Idle / Inactive), and inline action controls for live tracking and editing.
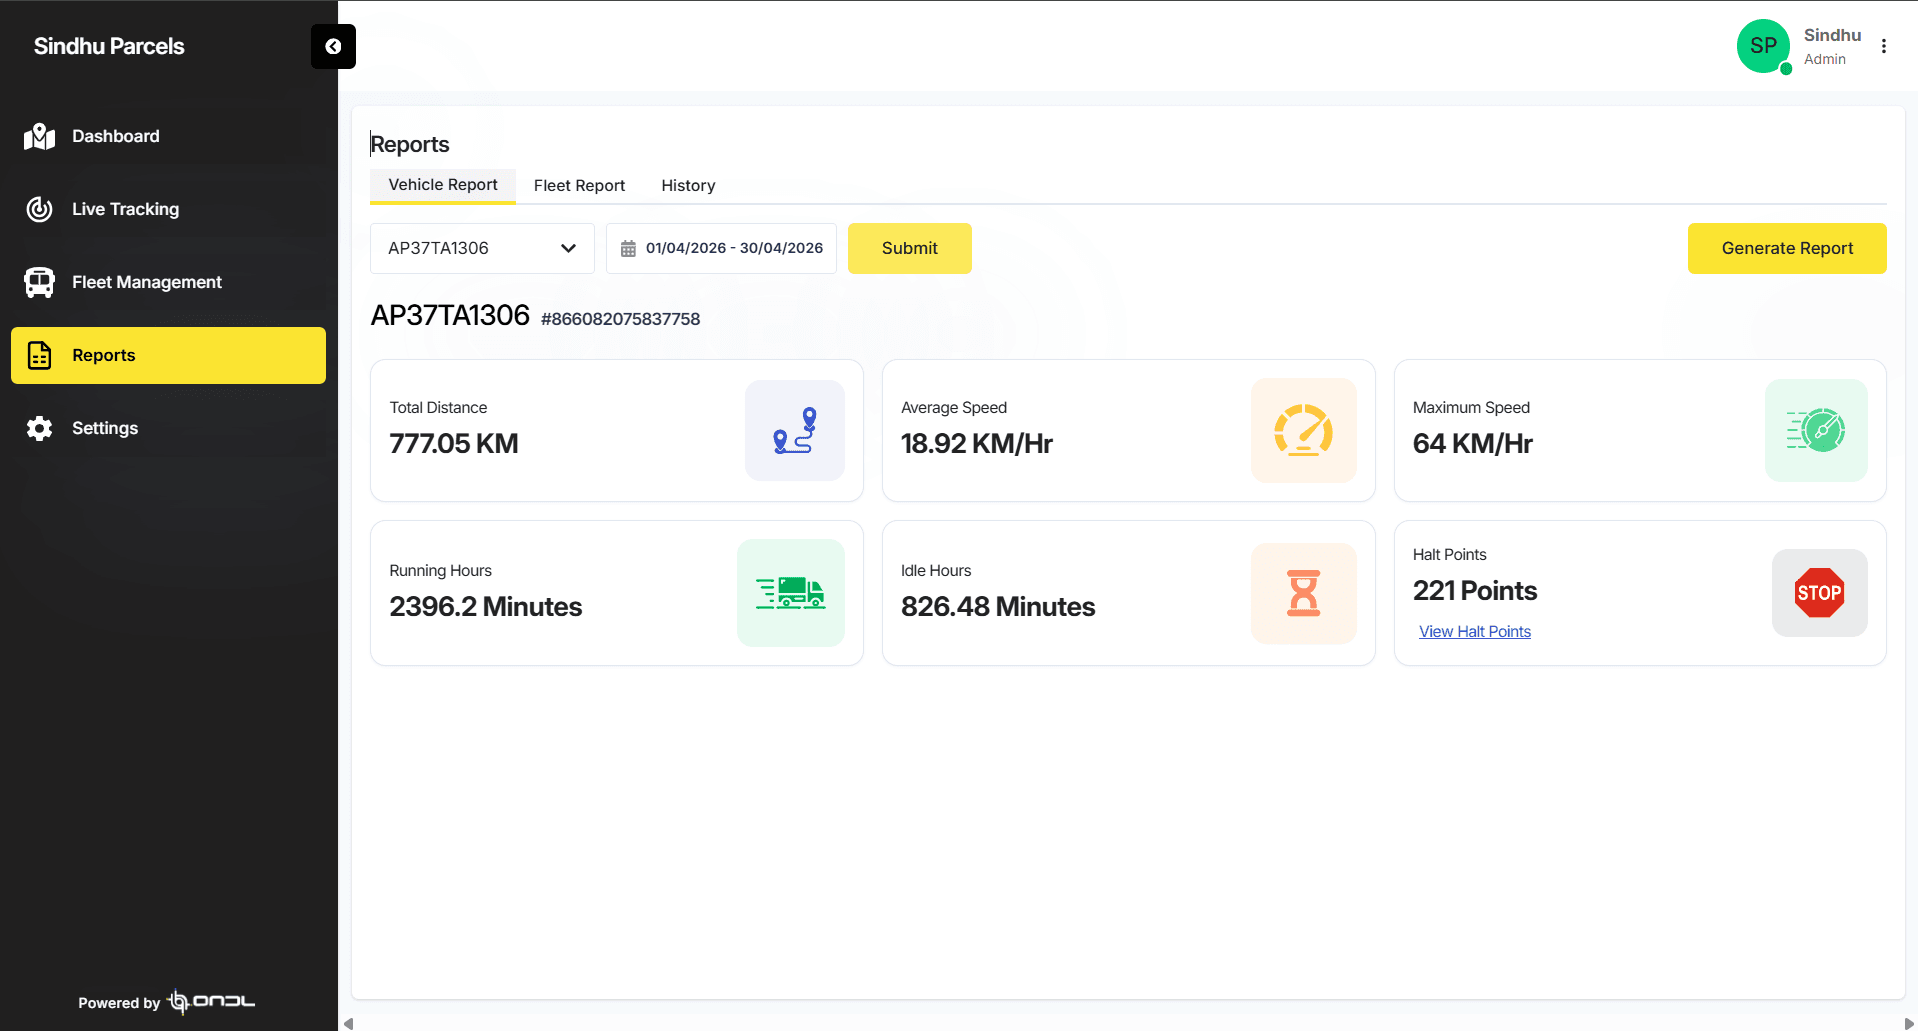
Reports ModuleVehicle Reports
Per-vehicle analytics covering total distance, average and maximum speed, running hours, idle time, and halt points — filterable by date range. Enables managers to measure efficiency and identify underperforming assets.
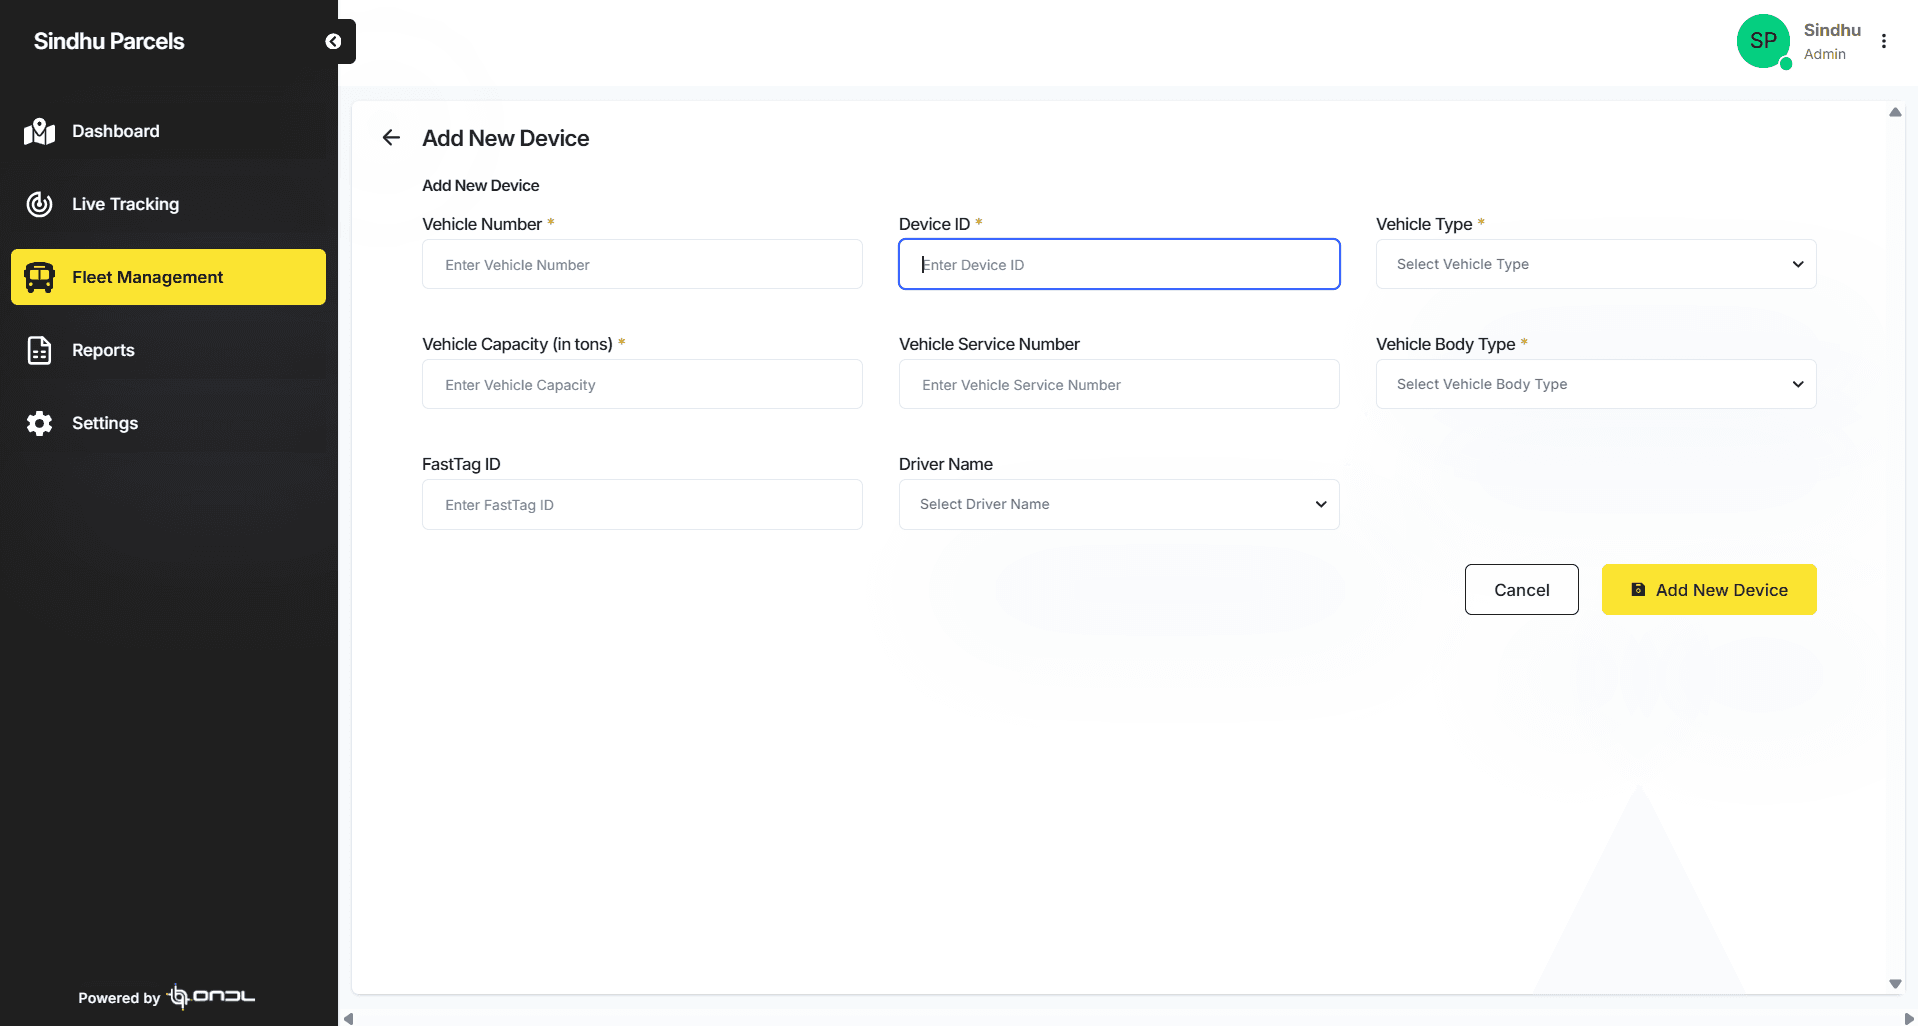
Fleet Management · Add DeviceAdd New Device
A structured onboarding form for registering fleet vehicles — capturing vehicle number, GPS device ID, vehicle type, capacity, service number, body type, FastTag ID, and driver assignment in a single workflow.
Core Capabilities
Trip Lifecycle Management
A structured state machine — Created → Dispatched → Ongoing → Completed → Closed — gives every stakeholder clear visibility into where a trip stands without any manual communication.
Frequent Route Suggestions
The system analyzed historical trips to recommend frequently used routes. Benefits: faster trip creation, reduced manual effort, and standardized operational workflows across branches.
Fuel Tracking
Fuel logs integrated directly into trip workflows — enabling mileage tracking, fuel efficiency reporting, and cost visibility per trip tied to the live operational record.
Driver Halt Tracking
Operators could track halt duration and delays during trips — improving operational accountability, driver payment workflows, and delay visibility for fleet managers.
Branch Notifications
Automatic announcements triggered when trips were created or dispatched. Replaced WhatsApp chains with context-aware, timestamped notifications across hubs.
Fleet Analytics
Integrated analytics enabling vehicle performance tracking, driver efficiency monitoring, operational optimization, and fleet utilization analysis — all from live trip data.
What Made This Hard
Designing for Complex Logistics Workflows
Fleet operations involved multiple stakeholders and edge-case scenarios — vehicles rerouted mid-trip, drivers swapping, branches changing plans. Balancing simplicity with operational depth became a central design challenge.
Built flexible trip states with override capabilities and designed exception handling directly into the workflow — not as an afterthought.
Managing Data-Heavy Interfaces
The platform required displaying large amounts of operational information without overwhelming users. A single dashboard could surface hundreds of data points simultaneously.
Careful prioritization of visual hierarchy, information grouping, and dashboard readability — with progressive disclosure to keep the primary view clean.
Multiple Stakeholder Needs
Fleet managers, branch managers, and accounts teams required different workflows and levels of visibility from the same underlying data. One screen could not serve all roles equally.
Role-based views with shared data — same trip record, different UI surfaces depending on who's looking. The product supported fleet ops, branch coordination, financial reconciliation, and driver monitoring.
Measurable Results
Product Impact Summary
Course correction
What I got wrong
- First take
- I modelled the product around vehicles, because that is how the fleet data was structured — one record per truck, with trips hanging off it.
- What changed it
- Every field session contradicted it. Managers never said a registration number; they said “the Chennai trip”. The data model matched the database, not the way anyone actually worked.
- What I did
- Rebuilt the information architecture around the trip as the core operational unit, with vehicles as an attribute of it. Exception handling — reroutes, driver swaps — moved into the trip states rather than being bolted on afterwards.
What This Project Taught Me
Final Reflection
Kudra was more than a fleet management dashboard.
It was an operational transformation project that introduced structure, visibility, and accountability into logistics workflows.
By shifting operations from fragmented communication into a centralized trip management ecosystem, the platform helped logistics teams operate with greater efficiency, transparency, and control.
"The project also highlighted how strong UX can reduce operational chaos in enterprise systems."
What Comes Next
Multi-Stop Trip Workflows
Support complex trips with multiple waypoints, intermediate pickups, and sequential delivery confirmations.
AI-Powered Route Optimization
AI-powered routing that suggests optimal paths based on traffic, distance, fuel efficiency, and historical trip data.
Predictive Fuel Analytics
ML-driven fuel consumption forecasting based on route, vehicle age, load weight, and driver behavior patterns.
Driver Mobile Application
Companion app for drivers enabling trip confirmation, halt logging, fuel entry, and delivery confirmation from the field.
Automated Dispatch Planning
AI-assisted dispatch that matches available vehicles and drivers to incoming trip requests based on capacity and location.
Fleet Intelligence Systems
Executive-level fleet intelligence dashboards with trend analysis, predictive maintenance alerts, and cost optimization.
What Was Produced
Want to work together?
Let's build something operationally transformative.